TDA-C01 — Free Practice Questions
10 free sample questions from a bank of 175, with the correct answers and explanations. No signup required — start practising right now.
1You are the owner of an alert.
You receive an email notification that the alert was suspended.
From where can you resume the suspended alert?
- The My Content area of Tableau web pages
- The Data Source page of Tableau Desktop
- The Notifications area of Tableau Prep
- The Shared with Me page
Answer: A
2A colleague provides you with access to a folder that contains the following files:
Sales.csv -
Book1.twb -
Sales.hyper -
Export.mdb -
Which file contains an extract?
- Export.mdb
- Sales.hyper
- Book1.twb
- Sales.csv
Answer: B
3You have a workbook that uses an extracted data source.
You publish the workbook to Tableau Server.
Which three actions can you perform from the Extract Refresh page in Tableau Server? (Choose three.)
- Run a refresh.
- Change the refresh from full to incremental.
- Change the priority of the refresh.
- Delete the refresh.
- Modify the frequency of the refresh.
Answer:
4HOTSPOT
-
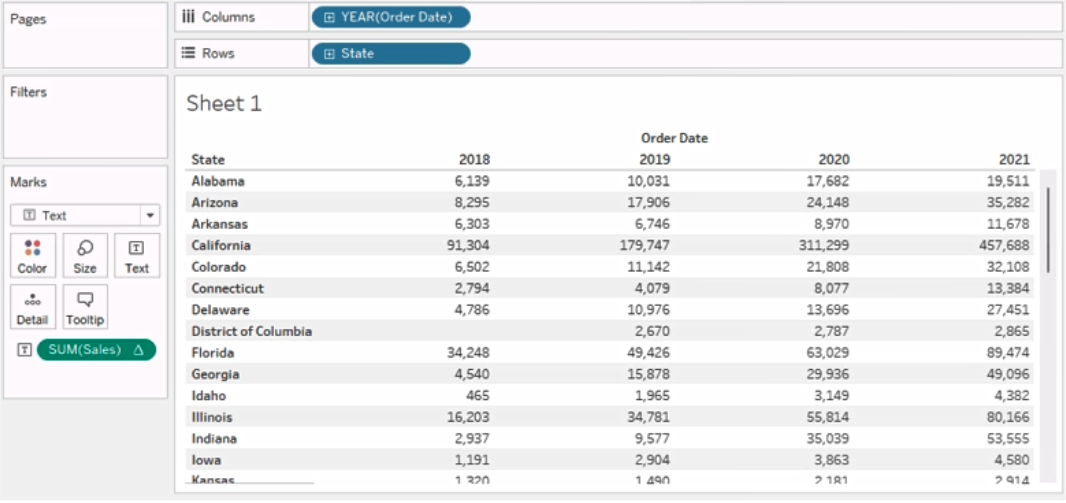
You have the following worksheet. You want to create a table calculation that shows sales growth over each year.
How should you complete the formula? (Use the dropdowns in the Answer Area to select the correct options to complete the formula.)

Answer:
5DRAG DROP
-
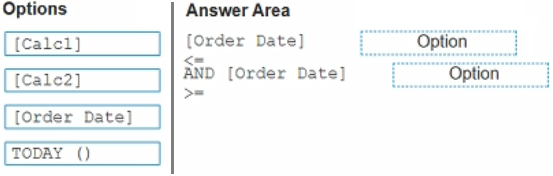
You have the following calculated fields in a worksheet.
[Calc1] = DATEADD (‘year’, -1, TODAY ())
[Calc2] = DATETRUNC (‘month’, DATEADD (‘year’, -1, TODAY ())
You want to calculate the month to date value of the prior year.
How should you complete the formula? (Drag the appropriate Options to the Answer Area and drop into the correct locations.)
Answer:
6You have the following sets in a Tableau workbook:
Top N Customers -
Customers of 2020 -
Top N Products -
Sellers of 2020 -
Which two sets can you combine? (Choose two.)
- Top N Customers
- Sellers of 2020
- Customers of 2020
- Top N Products
Answer:
7You subscribe to a view that delivers a daily email to your inbox.
You want to make the subscription available to other stakeholders.
What should you do?
- From the worksheet, modify the subscription.
- From the My Content overview page, modify the subscription.
- From the My Content overview page, modify the alert.
- From the dashboard overview page, modify the subscription.
Answer: A
8DRAG DROP
-
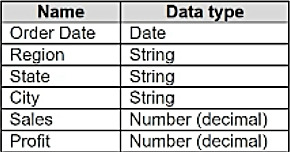
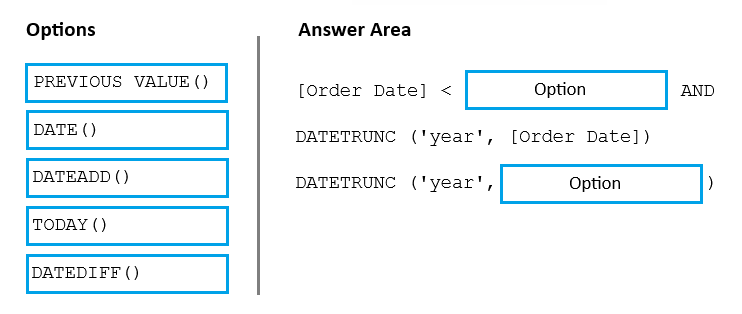
You have a data source that contains the following columns. You want to display year to date (YTD) sales.
How should you complete the formula? (Drag the appropriate Options to the Answer Area and drop into the correct locations.)
Answer:
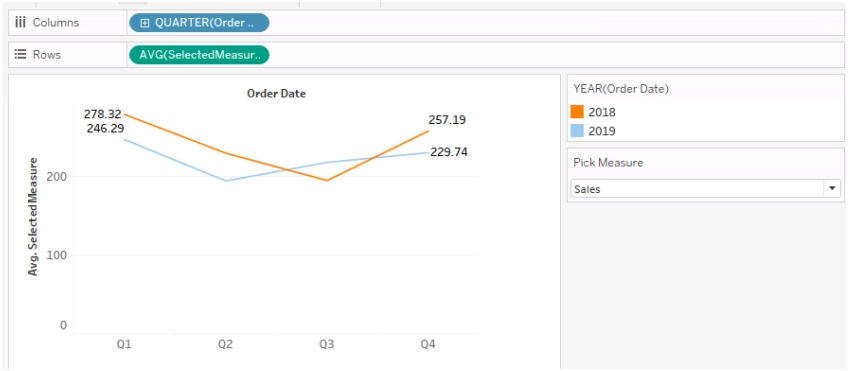
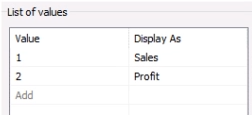
9You create the following worksheet. The Pick Measure parameter contains the following list of values. Users can select a value from Pick Measure to change the visualization to show either the Sales measure or the Profit measure.
Which formula is used in the SelectedMeasure calculated field to switch between measures?
Answer:
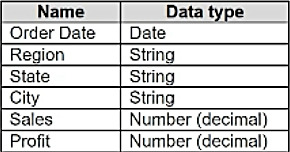
10You have a data source that contains the following columns. You have the following FIXED Level of Detail (LOD) expression.
[Region Sales] = {FIXED [Region] : SUM [Sales]}
You have a view that has a dimension filter on the State column to exclude five states.
What should you do to ensure that the five states are also excluded from the LOD expression?
- Right-click the State dimension filter, and then click Add to Context.
- Right-click the State dimension filter, and then click Attribute.
- Change the LOD expression to [Region Sales] = {FIXED [Region], [State]: SUM [Sales]}.
- Drag the LOD expression to the Filters shelf.
Answer: A
Want the full bank of 175 questions for TDA-C01? See all practice exams.