Microsoft Power BI Data Analyst (PL-300) — Free Practice Questions
10 free sample questions from a bank of 410, with the correct answers and explanations. No signup required — start practising right now.
- Microsoft Teams Personal Analytics
- SQL Server database
- Dataverse
- Dataflows
The short version
C — Dataverse connects Power BI to the Teams-hosted Power Apps app. Project data for Teams apps lives in Dataverse, not files or services.
Key concepts in this question
- Teams Power Apps storage: apps built for Teams persist tables in Microsoft Dataverse for Teams environments.
- Dataverse connector: Power BI native path to those tables with relationships and security preserved.
- Personal Analytics contrast: surfaces individual Teams usage insights, not custom app tables.
- SQL Server contrast: reaches on-premises or Azure SQL, unrelated to Dataverse-backed Teams apps.
- Dataflows contrast: cloud ETL and staging for reuse, not the direct app-table connector.
Why C is correct
A fully Teams-hosted Power Apps project app stores its entities in Dataverse, so Power BI must use the Dataverse connector to import or DirectQuery them. Vendor prose notes Project for web data is reached through the Dataverse instance behind the app. Other connectors point at wrong stores and would return no project tables. Unanimous consensus confirms C as the direct supported route.
Why the others are wrong
- A. Personal Analytics reports Teams activity, not custom Power Apps business tables.
- B. SQL Server database misses Dataverse storage used by Teams Power Apps.
- D. Dataflows stage and transform data but are not the source connector for the live app.
PL-300 exam tip
Teams Power Apps to Power BI equals Dataverse connector, files and SQL miss the app tables.
- Apply a transformation to extract the last 11 characters of the Logged column and set the data type of the new column to Date.
- Change the data type of the Logged column to Date.
- Split the Logged column by using at as the delimiter.
- Apply a transformation to extract the first 11 characters of the Logged column.
The short version
C — Split on at to isolate a clean date for hierarchy. The Logged value mixes date plus at plus time in one text field. Splitting on the word at yields a date part that converts to Date for built-in hierarchy.
Key concepts in this question
- Dirty datetime text: 2018-12-31 at 08 colon 59 is text, not a native Date or DateTime value.
- Split delimiter: using at as delimiter separates the date token from the time token cleanly.
- Date typing: casting the date token to Date enables sorting, filtering, and hierarchy use.
- Built-in hierarchy: Power BI date hierarchy needs a true Date column, ideally marked as date table.
- Fragile substring risk: fixed 11-char extracts break on format shifts, split is resilient.
Why C is correct
Power Query cannot build a date hierarchy from a single text string containing both date and time joined by at. Splitting the Logged column on at, as settled key C states, produces a date-only column plus a time-only column without guessing character positions. Typing the date part as Date then supports year-quarter-month-day drill and time-intelligence, which direct type change or fixed-length extracts cannot reliably give.
Why the others are wrong
- A. Extracting the last 11 characters targets the time fragment and mistypes the hierarchy source.
- B. Changing type of the whole mixed string fails or yields DateTime without a clean date hierarchy base.
- D. Extracting the first 11 characters is position-fragile and inferior to delimiter-based split logic.
PL-300 exam tip
Mixed date plus word plus time, split on the word then set Date type.
- Excel Workbook
- Text/CSV
- Folder
- SharePoint folder
- Web
The short version
DE — SharePoint folder plus Web enable cloud refresh for OneDrive Excel. Local file and folder paths trap the dataset on Desktop. Cloud-aware connectors route through OneDrive for scheduled refresh.
Key concepts in this question
- OneDrive storage path: Excel file lives in OneDrive, reachable via SharePoint backend or Web URL.
- Refreshable connectors: SharePoint folder and Web store cloud credentials for powerbi dot com refresh.
- Excel Workbook trap: direct Workbook import from local path lacks a cloud refresh route.
- Folder connector scope: generic Folder points at filesystem paths, not OneDrive cloud identity.
- Two-solution requirement: two connectors each present a complete refreshable path.
Why DE is correct
A Power BI dataset refreshes in the service only when its source connector can authenticate in the cloud and reach the file without the author laptop. SharePoint folder, as settled key D, navigates the OneDrive library through Microsoft 365 identity, while Web, as settled key E, addresses the file by URL with stored credentials. Both satisfy scheduled refresh, while local Excel Workbook and Folder connectors leave the dataset bound to a personal path.
Why the others are wrong
- A. Excel Workbook from a local or personal path cannot refresh unattended in the service.
- B. Text slash CSV targets the wrong file type and still misses the OneDrive cloud route.
- C. Folder connector addresses on-prem or personal filesystems, not cloud-refreshable OneDrive storage.
PL-300 exam tip
OneDrive Excel must refresh, choose SharePoint folder or Web, never local.
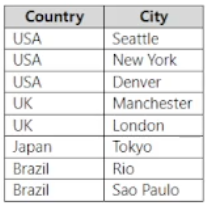
- Delete the Country column.
- Remove duplicates from the table.
- Remove duplicates from the City column.
- Delete the City column.
- Remove duplicates from the Country column.
The short version
DE — Delete City plus deduplicate Country builds a unique Country dimension. City detail is unneeded grain, Country needs distinct list for star schema.
Key concepts in this question
- Dimension grain: Country dimension must have one row per country for clean surrogate and relationships.
- City removal: dropping City eliminates the finer grain that would otherwise force duplicates.
- Country deduplication: Remove duplicates on Country collapses repeats to a unique list.
- Wrong-column traps: deleting Country destroys the target, deduping City keeps city grain, table dedupe without column shaping misses intent.
- Star schema benefit: narrow conformed dimensions improve filtering and model performance.
Why DE is correct
Source snapshot pairs cities with countries, so keeping both preserves many rows per country. Deleting City, per D, leaves only Country values, then removing duplicates on Country, per E, yields the distinct set required. Vendor and consensus favor DE because that sequence produces exactly the dimension grain. Other combos either drop the needed column or dedupe the wrong level.
Why the others are wrong
- A. Deleting Country removes the very attribute the dimension must contain.
- B. Removing table duplicates without shaping still leaves city-level variation in rows.
- C. Deduplicating City preserves city grain instead of collapsing to country level.
PL-300 exam tip
Unique Country dimension equals delete City first, then remove duplicates on Country.
- You do not have permissions to the file.
- An incorrect privacy level was used for the data source.
- The file is locked.
- The referenced file was moved to a new location.
The short version
AD — No permission plus moved file explain Could not find file. Both break path resolution before privacy or lock handling applies.
Key concepts in this question
- Datasource Error Could not find file: Power Query cannot open the referenced path during evaluation.
- Permission cause: lacking read rights surfaces as not-found when the engine cannot enumerate the location.
- Moved file cause: renamed or relocated source leaves the saved path pointing at nothing.
- Privacy level contrast: wrong privacy triggers Formula Firewall combination errors, not file-not-found.
- Locked file contrast: open-by-another-process yields access-busy messaging, not missing path.
Why AD is correct
When credentials or ACLs deny access, the mashup engine reports the file as missing rather than forbidden. When the Excel or file asset moved, the stored path no longer resolves and the same message appears. Vendor detail distinguishes those from firewall and lock texts with near-unanimous consensus for AD. Checking effective access and updating the path are therefore the two complete solutions.
Why the others are wrong
- B. Incorrect privacy level blocks query folding combos with firewall text, not file lookup.
- C. Locked file reports in-use contention, distinct from could-not-find path errors.
PL-300 exam tip
Could not find file equals check permissions plus check moved path, privacy and locks give different errors.
- Add a SQL statement.
- Set the Command timeout in minutes setting.
- Set Data Connectivity mode to Import.
- Set Data Connectivity mode to DirectQuery.
The short version
D — DirectQuery surfaces Azure SQL changes within minutes. Import caches data until scheduled refresh, missing the five-minute freshness SLA. Live query passes report filters straight to the database.
Key concepts in this question
- Freshness SLA: fraud reports must reflect transactions visible within five minutes of update.
- DirectQuery behavior: visuals generate SQL per interaction against the live Azure SQL source.
- Import latency: cached model refreshes on schedule, often hourly, too slow for this need.
- SQL statement irrelevance: custom SQL shapes logic but does not change connectivity mode.
- Timeout irrelevance: command timeout tolerates long queries, it does not make data fresher.
Why D is correct
Frequently updated sales transactions with a five-minute visibility rule require a live connection rather than a cached snapshot. Setting Data Connectivity mode to DirectQuery, as settled key D states, keeps no imported copy and queries Azure SQL at report time, so new fraud-relevant rows appear almost immediately. Import mode would hide updates until the next refresh cycle and breach the SLA regardless of SQL text or timeout tuning.
Why the others are wrong
- A. Adding a SQL statement refines row logic but leaves Import caching delay in place.
- B. Command timeout extends query patience, it does not deliver fresher data.
- C. Import mode caches data and refreshes too slowly for five-minute visibility.
PL-300 exam tip
Minutes-fresh reporting on SQL, answer DirectQuery, not Import.
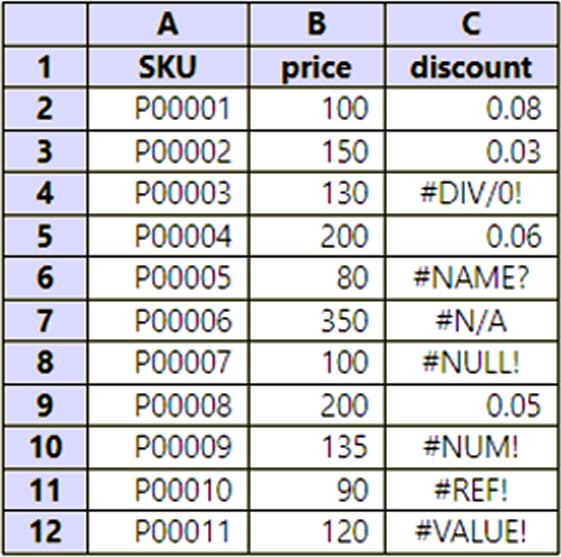
- Select Replace Errors.
- Edit the query in the Query Errors group.
- Select Remove Errors.
- Select Keep Errors.
The short version
A — Replace Errors swaps discount errors to 0 point 05 while keeping rows. One column command preserves grain with minimal effort.
Key concepts in this question
- Keep-all-rows mandate: every source row must remain, ruling out removal or filtering of error rows.
- Replace Errors command: substitutes a supplied value for each error in the selected column in one step.
- 0 point 05 business rule: the required substitute for any discount failure, applied uniformly.
- Query Errors group contrast: drilling into error rows aids diagnosis but does not itself fix values.
- Remove and Keep Errors contrast: one deletes data, the other isolates errors, both violate the keep-plus-fix need.
Why A is correct
Selecting Replace Errors on the discount column writes 0 point 05 wherever evaluation failed while leaving all other rows untouched. That satisfies error-to-value plus full retention plus minimal clicks in a single operation. Vendor prose confirms Replace Errors is correct because Remove would drop rows and Keep would retain faults. Unanimous consensus supports A as the least-effort compliant action.
Why the others are wrong
- B. Editing in Query Errors inspects failures without applying the required replacement value.
- C. Remove Errors deletes failing rows, violating the maintain-all-rows rule.
- D. Keep Errors filters to only faults, the opposite of a complete fixed dataset.
PL-300 exam tip
Errors to fixed value plus keep rows equals Replace Errors, never Remove or Keep.
- Create a dataflows connection that has DirectQuery mode selected.
- Create a dataflows connection that has DirectQuery mode selected and configure a gateway connection for the dataset.
- Create a dataflows connection that has Import mode selected and schedule a daily refresh.
- Create a dataflows connection that has Import mode selected and create a Microsoft Power Automate solution to refresh the data hourly.
The short version
C — Import the dataflow with daily refresh to cut online cost. DirectQuery re-queries on every visual and keeps gateway load high. Cached import plus once-daily refresh meets prior-day scope with fast renders.
Key concepts in this question
- Dataflow Compute Engine: enhanced engine accelerates transformations but downstream mode still matters.
- Import caching: dataset stores compressed data for fast visuals without per-click source queries.
- Daily refresh fit: current-year through previous day tolerates a once-daily load window.
- Gateway burden: DirectQuery keeps on-prem SQL in the critical path for every interaction.
- Over-refresh waste: hourly automation adds load without business need for intraday freshness.
Why C is correct
Requirements demand minimal online processing plus fast calc and render times for current-year to previous-day data. Creating a dataflows connection in Import mode and scheduling a daily refresh, as settled key C states, loads the needed window once and serves visuals from cache. That removes per-visual DirectQuery round trips through the gateway while still meeting the previous-day freshness rule.
Why the others are wrong
- A. DirectQuery mode keeps every visual dependent on live on-prem queries, maximizing online load.
- B. DirectQuery plus gateway still pays per-interaction cost despite connectivity correctness.
- D. Import plus hourly automation meets freshness but wastes refresh cycles beyond the daily need.
PL-300 exam tip
Minimize visuals cost with prior-day scope, import plus daily refresh wins.
- Merge queries
- Combine files
- Append queries
The short version
A — Merge queries combines Order Header plus Details on Order ID. Merge adds columns from a related table, preserving unique columns side by side.
Key concepts in this question
- Merge queries purpose: joins two queries on matching keys to bring columns together horizontally.
- Order ID key: shared column linking header and line detail for enrichment.
- Unique columns goal: needs fields from both tables in one result, not stacked rows.
- Append contrast: stacks rows with same structure, unsuitable for header-plus-line column merge.
- Combine files contrast: unions multiple files from a folder, not a keyed header-detail join.
Why A is correct
Combining header and details by Order ID is a classic lookup join: keep header rows and expand matching detail columns into the same query. Merge queries performs exactly that keyed column addition. Vendor docs define merging for adding columns and appending for adding rows, with strong consensus for A. Append would mismatch schemas, while combine files targets folder ingestion.
Why the others are wrong
- B. Combine files merges folder files, not two keyed SQL tables on Order ID.
- C. Append queries stacks rows, which would not align header columns with detail columns.
PL-300 exam tip
Add columns via key equals Merge, add rows equals Append, many files equals Combine files.
- Microsoft SQL Server database
- ODBC
- OLE DB
- OData
The short version
B — Use ODBC for Cassandra without a native connector. No bespoke Get Data entry exists, so a generic standard driver bridges Power BI to the source. ODBC is the documented fallback for such stores.
Key concepts in this question
- Native-connector gap: Power BI Desktop lists no dedicated Cassandra connector.
- ODBC bridge: open standard driver interface with Cassandra ODBC drivers for tabular access.
- OLE DB legacy: older Microsoft-centric interface, less suited to this cross-platform source.
- SQL Server mismatch: SQL Server connector speaks T-SQL over its own protocol, not Cassandra dialect.
- OData mismatch: OData expects an HTTP feed service, not a Cassandra cluster endpoint.
Why B is correct
When Get Data lacks a purpose-built connector, Power BI falls back to generic interfaces that delegate dialect handling to an installed driver. ODBC, as settled key B states, has available Cassandra drivers that expose keyspaces as tables for import or DirectQuery. That makes ODBC the correct alternate connector, while SQL Server, OLE DB, and OData point at incompatible protocols or services.
Why the others are wrong
- A. SQL Server connector targets Microsoft SQL protocol and cannot parse Cassandra storage.
- C. OLE DB is legacy and lacks the standard Cassandra driver path that ODBC provides.
- D. OData consumes HTTP entity feeds, not direct Cassandra cluster connectivity.
PL-300 exam tip
Missing native connector for a database, default to ODBC as the bridge.
Want the full bank of 410 questions for Microsoft Power BI Data Analyst (PL-300)? See all practice exams.