DP-500 — Free Practice Questions
10 free sample questions from a bank of 213, with the correct answers and explanations. No signup required — start practising right now.
1This is a case study. Case studies are not timed separately. You can use as much exam time as you would like to complete each case. However, there may be additional case studies and sections on this exam. You must manage your time to ensure that you are able to complete all questions included on this exam in the time provided.
To answer the questions included in a case study, you will need to reference information that is provided in the case study. Case studies might contain exhibits and other resources that provide more information about the scenario that is described in the case study. Each question is independent of the other questions in this case study.
At the end of this case study, a review screen will appear. This screen allows you to review your answers and to make changes before you move to the next section of the exam. After you begin a new section, you cannot return to this section.
To start the case study -
To display the first question in this case study, click the Next button. Use the buttons in the left pane to explore the content of the case study before you answer the questions. Clicking these buttons displays information such as business requirements, existing environment, and problem statements. If the case study has an All Information tab, note that the information displayed is identical to the information displayed on the subsequent tabs. When you are ready to answer a question, click the Question button to return to the question.
Overview -
Contoso, Ltd. is a company that sells enriched financial data to a variety of external customers.
Contoso has a main office in Los Angeles and two branch offices in New York and Seattle.
Existing Environment -
Data Infrastructure -
Contoso has a 50-TB data warehouse that uses an instance of SQL Server on Azure Virtual Machines.
The data warehouse populates an Azure Synapse Analytics workspace that is accessed by the external customers. Currently, the customers can access all the data.
Contoso has one Power BI workspace named FinData that contains a single dataset. The dataset contains financial data from around the world. The workspace is used by 10 internal users and one external customer. The dataset has the following two data sources: the data warehouse and the Synapse Analytics serverless SQL pool.
Users frequently query the Synapse Analytics workspace by using Transact-SQL.
User Problems -
Contoso identifies the following user issues:
Some users indicate that the visuals in Power BI reports are slow to render when making filter selections.
Users indicate that queries against the serverless SQL pool fail occasionally because the size of tempdb has been exceeded.
Users indicate that the data in Power BI reports is stale. You discover that the refresh process of the Power BI model occasionally times out.
Planned Changes -
Contoso plans to implement the following changes:
Into the existing Power BI dataset, integrate an external data source in JSON that is accessible by using the REST API.
Build a new dataset in the FinData workspace by using data from the Synapse Analytics dedicated SQL pool.
Provide all the customers with their own Power BI workspace to create their own reports. Each workspace will use the new dataset in the FinData workspace.
Implement subscription levels for the customers. Each subscription level will provide access to specific rows of financial data.
Deploy prebuilt datasets to Power BI to simplify the query experience of the customers.
Provide internal users with the ability to incorporate machine learning models loaded to the dedicated SQL pool.
You need to identify the root cause of the data refresh issue.
What should you use?
- the Usage Metrics Report in powerbi.com
- Query Diagnostics in Power Query Editor
- Performance analyzer in Power BI Desktop
Answer: B
2This is a case study. Case studies are not timed separately. You can use as much exam time as you would like to complete each case. However, there may be additional case studies and sections on this exam. You must manage your time to ensure that you are able to complete all questions included on this exam in the time provided.
To answer the questions included in a case study, you will need to reference information that is provided in the case study. Case studies might contain exhibits and other resources that provide more information about the scenario that is described in the case study. Each question is independent of the other questions in this case study.
At the end of this case study, a review screen will appear. This screen allows you to review your answers and to make changes before you move to the next section of the exam. After you begin a new section, you cannot return to this section.
To start the case study -
To display the first question in this case study, click the Next button. Use the buttons in the left pane to explore the content of the case study before you answer the questions. Clicking these buttons displays information such as business requirements, existing environment, and problem statements. If the case study has an All Information tab, note that the information displayed is identical to the information displayed on the subsequent tabs. When you are ready to answer a question, click the Question button to return to the question.
Overview -
Existing environment -
Litware, Inc. is a retail company that sells outdoor recreational goods and accessories. The company sells goods both online and its stores located in six countries.
Azure Resources -
Litware has the following Azure resources:
An Azure Synapse Analytics workspace named synapseworkspace1
An Azure Data Lake Storage Gen2 account named datalake1 that is associated with synapseworkspace1
A Synapse Analytics dedicated SQL pool named SQLDW
Dedicated SQL Pool -
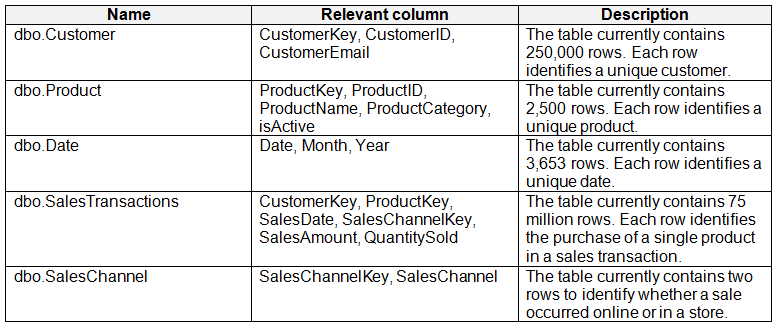
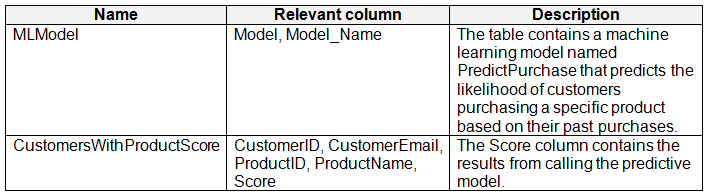
SQLDW contains a dimensional model that contains the following tables. SQLDW contains the following additional tables. SQLDW contains a view named dbo.CustomerPurchases that creates a distinct list of values from dbo.Customer [customerID], dbo.Customer [CustomerEmail], dbo.Product [ProductID] and dbo.Product [ProductName].
The sales data in SQLDW is updated every 30 minutes. Records in dbo.SalesTransactions are updated in SQLDW up to three days after being created. The records do NOT change after three days.
Power BI -
Litware has a new Power BI tenant that contains an empty workspace named Sales Analytics.
All users have Power BI Premium per user licenses.
IT data analytics are workspace administrators. The IT data analysts will create datasets and reports.
A single imported dataset will be created to support the company’s sales analytics goals. The dataset will be refreshed every 30 minutes.
Requirements -
Analytics Goals -
Litware identifies the following analytics goals:
Provide historical reporting of sales by product and channel over time.
Allow sales managers to perform ad hoc sales reporting with minimal effort.
Perform market basket analysis to understand which products are commonly purchased in the same transaction.
Identify which customers should receive promotional emails based on their likelihood of purchasing promoted products.
Litware plans to monitor the adoption of Power BI reports over time. The company wants custom Power BI usage reporting that includes the percent change of users that view reports in the Sales Analytics workspace each month.
Security Requirements -
Litware identifies the following security requirements for the analytics environment:
All the users in the sales department and the marketing department must be able to see Power BI reports that contain market basket analysis and data about which customers are likely to purchase a product.
Customer contact data in SQLDW and the Power BI dataset must be labeled as Sensitive. Records must be kept of any users that use the sensitive data.
Sales associates must be prevented from seeing the CustomerEmail column in Power BI reports.
Sales managers must be prevented from modifying reports created by other users.
Development Process Requirements
Litware identifies the following development process requirements:
SQLDW and datalake1 will act as the development environment. Once feature development is complete, all entities in synapseworkspace1 will be promoted to a test workspace, and then to a production workspace.
Power BI content must be deployed to test and production by using deployment pipelines.
All SQL scripts must be stored in Azure Repos.
The IT data analysts prefer to build Power BI reports in Synapse Studio.
You need to configure the Sales Analytics workspace to meet the ad hoc reporting requirements.
What should you do?
- Grant the sales managers the Build permission for the existing Power BI datasets.
- Grant the sales managers admin access to the existing Power BI workspace.
- Create a deployment pipeline and grant the sales managers access to the pipeline.
- Create a PBIT file and distribute the file to the sales managers.
Answer: A
3You plan to modify a Power BI dataset.
You open the Impact analysis panel for the dataset and select Notify contacts.
Which contacts will be notified when you use the Notify contacts feature?
- the Power BI admins
- the workspace admins of any workspace that uses the dataset
- all the workspace members of any workspace that uses the dataset
- any users that accessed a report that uses the dataset within the last 30 days
Answer: B
4You are using a Python notebook in an Apache Spark pool in Azure Synapse Analytics.
You need to present the data distribution statistics from a DataFrame in a tabular view.
Which method should you invoke on the DataFrame?
- rollup
- cov
- explain
- describe
Answer: D
5Note: This question is part of a series of questions that present the same scenario. Each question in the series contains a unique solution that might meet the stated goals. Some question sets might have more than one correct solution, while others might not have a correct solution.
After you answer a question in this question, you will NOT be able to return to it. As a result, these questions will not appear in the review screen.
You are using an Azure Synapse Analytics serverless SQL pool to query a collection of Apache Parquet files by using automatic schema inference. The files contain more than 40 million rows of UTF-8-encoded business names, survey names, and participant counts. The database is configured to use the default collation.
The queries use OPENROWSET and infer the schema shown in the following table. You need to recommend changes to the queries to reduce I/O reads and tempdb usage.
Solution: You recommend using OPENROWSET WITH to explicitly define the collation for businessName and surveyName as Latin1_General_100_BIN2_UTF8.
Does this meet the goal?

- Yes
- No
Answer: A
6You are using a Python notebook in an Apache Spark pool in Azure Synapse Analytics.
You need to present the data distribution statistics from a Data Frame in a tabular view.
Which method should you invoke on the Data Frame?
- sample
- describe
- freqItems
- explain
Answer: B
7You have a deployment pipeline for a Power BI workspace. The workspace contains two datasets that use import storage mode.
A database administrator reports a drastic increase in the number of queries sent from the Power Bi service to an Azure SQL database since the creation of the deployment pipeline.
An investigation into the issue identifies the following:
One of the datasets is larger than 1 GB and has a fact table that contains more than 500 million rows.
When publishing dataset changes to development, test, or production pipelines, a refresh is triggered against the entire dataset.
You need to recommend a solution to reduce the size of the queries sent to the database when the dataset changes are published to development, test, or production.
What should you recommend?
- Request the authors of the deployment pipeline datasets to reduce the number of datasets republished during development.
- In the dataset, delete the fact table.
- Configure the dataset to use a composite model that has a DirectQuery connection to the fact table.
- From Capacity settings in the Power Bi Admin portal, reduce the Max Intermediate Row Set Count setting.
Answer: C
8HOTSPOT -
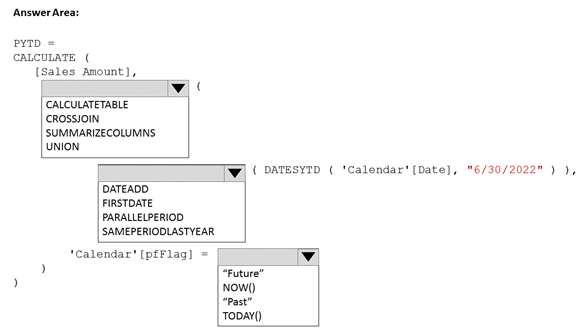
You are building a Power BI dataset that contains a table named Calendar. Calendar contains the following calculated column. You need to create a measure that will perform a fiscal prior year-to-date calculation that meets the following requirements:
Returns the fiscal prior year-to-date value for [Sales Amount]
Uses a fiscal year end of June 30
Produces no result for dates in the future
How should you complete the DAX expression? To answer, select the appropriate options in the answer area.
NOTE: Each correct selection is worth one point.

Answer:
9Note: This question is part of a series of questions that present the same scenario. Each question in the series contains a unique solution that might meet the stated goals. Some question sets might have more than one correct solution, while others might not have a correct solution.
After you answer a question in this section, you will NOT be able to return to it. As a result, these questions will not appear in the review screen.
You have a Power Bi dataset named Dataset1.
In Dataset1, you currently have 50 measures that use the same time intelligence logic.
You need to reduce the number of measures, while maintaining the current functionality.
Solution: From Power BI Desktop, you create a hierarchy.
Does this meet the goal?
- Yes
- No
Answer: B
10Note: This question is part of a series of questions that present the same scenario. Each question in the series contains a unique solution that might meet the stated goals. Some question sets might have more than one correct solution, while others might not have a correct solution.
After you answer a question in this section, you will NOT be able to return to it. As a result, these questions will not appear in the review screen.
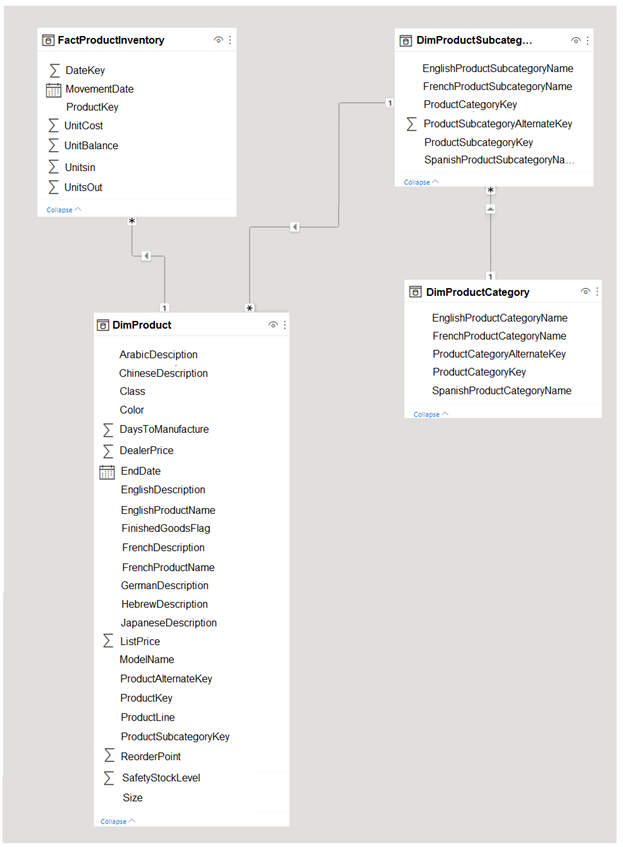
You have the Power BI data model shown in the exhibit. (Click the Exhibit tab.) Users indicate that when they build reports from the data model, the reports take a long time to load.
You need to recommend a solution to reduce the load times of the reports.
Solution: You recommend normalizing the data model.
Does this meet the goal?
- Yes
- No
Answer: B
Want the full bank of 213 questions for DP-500? See all practice exams.