Certified Tableau CRM and Einstein Discovery Consultant — Free Practice Questions
10 free sample questions from a bank of 96, with the correct answers and explanations. No signup required — start practising right now.
- Create a Visualforce page and display a list view of the opportunities on this new page.
- Create a link to download the list of opportunities as an Excel file.
- Create a second page on the dashboard and move the table to this new page.
- Create a second dashboard and move the table to this new dashboard.
The short version
C — Move the slow table to a second dashboard page. Tableau CRM loads all widgets on a page together, so isolating the 30-second table lets the fast queries render immediately.
Key concepts in this question
- Dashboard page load behavior: All queries on the current page execute on load; one slow query blocks perceived performance.
- Progressive disclosure: Splitting heavy content onto a second page defers its query until the user navigates there.
- Table queries: Unaggregated record tables scan many rows and are typically slower than grouped charts.
Why C is correct
Tableau CRM executes the queries for the visible page when a dashboard opens. Moving the 30-second Opportunities table to a second page means the first page with its sub-five-second queries loads quickly, and the heavy table query only runs when that page is viewed. This directly addresses the bottleneck without losing functionality.
Why the others are wrong
- A. Visualforce list views leave Tableau CRM entirely and do not fix dashboard query performance.
- B. Exporting to Excel is a workaround for data access, not a performance fix for the dashboard.
- D. A wholly separate dashboard breaks context; a second page preserves filters and user experience.
Certified-Tableau-CRM-and-Einstein-Discovery-Consultant exam tip
Slow table on fast dashboard = new page to defer the heavy query.
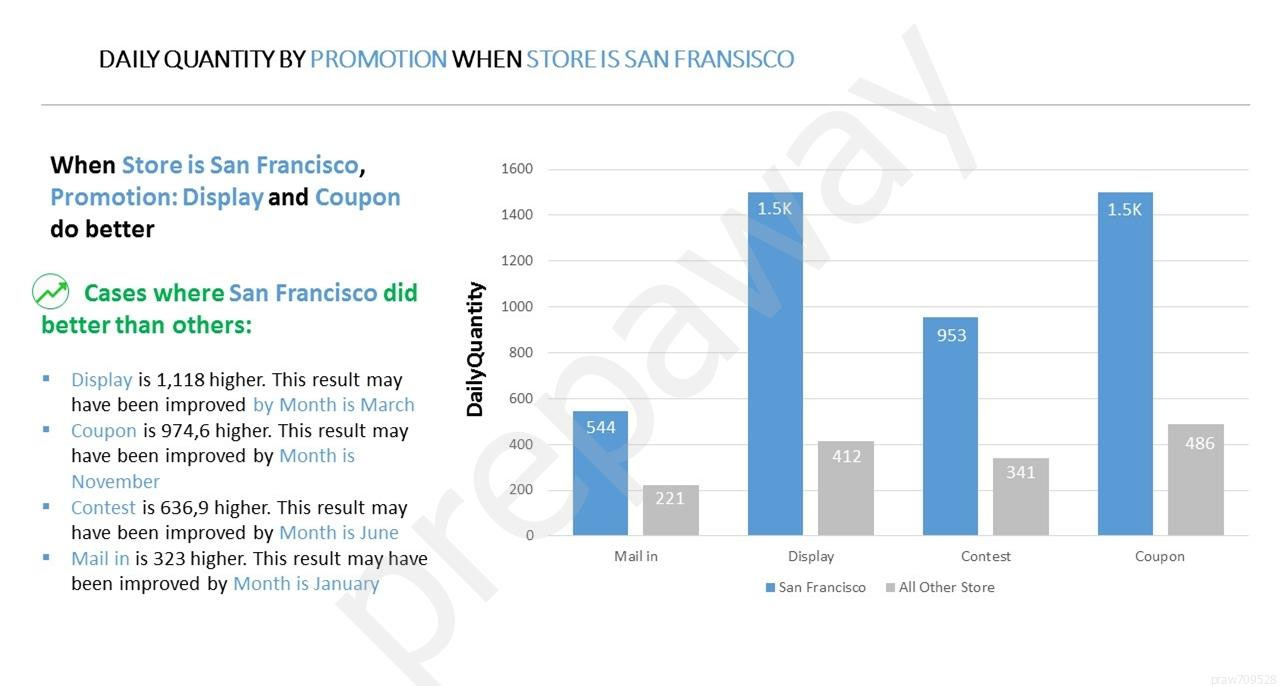
- The best promotion type is Display.
- Promotions increase sales stronger in San Francisco than they do in other cities.
- The Other stores (visualized with the gray bars) show no significant data for the sales promotions.
- Of all promotions types in San Francisco, sales were the highest using Display promotion.
The short version
D — In San Francisco, Display drove the highest sales among promotion types. The insight is scoped to city plus promotion type, not a cross-city lift claim.
Key concepts in this question
- Story scope: Insights are conditioned on the filters shown, here San Francisco plus promotional activity.
- Conditional comparison: Bars compare promotion types within San Francisco, with gray Other-stores bars as context.
- Maximize objective: The story optimizes daily sales quantity, so reading must stay tied to observed sales.
Why D is correct
The chart isolates San Francisco and breaks out promotional activity by type. Within that slice, Display shows the highest sales, so the only supported conclusion is that Display was the top promotion type in San Francisco. It does not prove Display is best everywhere, nor quantify lift versus other cities.
Why the others are wrong
- A. Claims Display is best overall, but the view is filtered to San Francisco and cannot generalize.
- B. Claims stronger lift in San Francisco than elsewhere, which needs a cross-city comparison not shown.
- C. Misreads gray Other-stores bars; they provide context, not a finding of no promotion data.
Certified-Tableau-CRM-and-Einstein-Discovery-Consultant exam tip
Read Einstein charts only within their filters: city plus type means best type in that city.
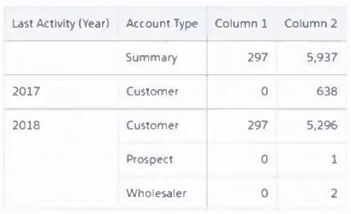
- Use a SAQL query since the summary is not available in standard interface.
- Create a computeExpression field in the Dataflow to calculate the summary.
- Use the Show Summary option in the compare table.
- Add a formula field to calculate the summary.
The short version
A — Build the first-line summary with SAQL. Compare tables expose no native top-line summary, so a SAQL query computes it explicitly.
Key concepts in this question
- Compare table limits: Grouped compare tables sort and subtotal by grouping, without a free-form grand-summary first row.
- SAQL flexibility: SAQL supports grouping and custom aggregate rows the point-and-click builder cannot express.
- Compute vs display: Dataflow computeExpression and lens formulas add fields, not a synthetic summary row.
Why A is correct
The requirement is a summary rendered as the first line of a compare table, which standard Show Summary and formatting options do not support. A SAQL query can calculate the aggregate and return it as the leading row alongside grouped rows, giving full control over calculation and placement.
Why the others are wrong
- B. A Dataflow computeExpression creates a new field value per row, not a summary row in the visualization.
- C. Show Summary is not available for this compare-table first-line summary pattern.
- D. A lens formula field calculates per-column values, not a pinned aggregate first line.
Certified-Tableau-CRM-and-Einstein-Discovery-Consultant exam tip
First-row summary in compare table = SAQL, not UI summary.
- flatten
- cluster
- bucket
- format dates
The short version
The list filter shows numbers because CloseDate_Month stores month numbers, so the fix must create named values from those numbers. Bucketing categorizes numbers into labeled groups, which is exactly the month-name requirement, while Format Dates only standardizes mixed-format date text.
Key concepts in this question
Bucket creates a new dimension whose values are labels the consultant defines from existing column values. Format Dates assumes a text column holding dates written in inconsistent formats and rewrites them into one consistent format. A numeric month field is neither text nor inconsistently formatted, so the standardization tool does not apply.
Why C is correct
Bucket accepts a numeric input such as month numbers and outputs a new dimension carrying month names. That matches the goal of showing names instead of numbers in the list widget. Salesforce documentation describes bucketing as the way to group numbers, text, and date fields, which covers this case directly. The vendor prose also selects bucket, confirming the intended reading of the requirement.
Why the others are wrong
Format Dates fails because the source is numeric rather than mixed-format date text, so there is nothing to standardize. Flatten is built for hierarchical data such as role trees, not for relabeling month numbers into names. Cluster segments rows into statistically derived groups, which never yields a deterministic twelve-value month-name dimension. None of these alternatives yields a clean month-name filter for managers.
Certified-Tableau-CRM-and-Einstein-Discovery-Consultant exam tip
Expect the exam to contrast bucket against Format Dates whenever month or quarter names are needed from numeric date parts. Choose bucket when creating new labeled values, and reserve Format Dates for text columns with inconsistent date spellings. Remember that bucketing numbers, text, and dates is the documented grouping mechanism in Data Prep recipes.
- Change the method of binning to fixed width.
- Nothing, because the field is not the outcome variable.
- Remove the outlier rows.
- Remove the field because it has bad data.
The short version
Skewed predictors with outliers distort means and deviations, directly reducing prediction accuracy. Salesforce documents outliers as selectively excludable, making row removal the supported remedy, while fixed-width binning handles skew poorly.
Key concepts in this question
An outlier is a data point unusually distant from the average, potentially caused by entry errors or rare events. Skewed predictors let a few extreme values dominate averages and spread, pulling the model away from typical behavior. Einstein Discovery surfaces data issues such as outliers through recommended updates during analysis. The consultant must therefore neutralize the extreme rows rather than reshape bins around them.
Why C is correct
Removing the outlier rows takes the distorting values out of training so averages and deviations reflect the genuine population. Salesforce glossary language explicitly permits selectively excluding outliers from a model, which authorizes this action. The remedy targets the stated problem, since the field is fine apart from its extreme tail. Keeping a skewed predictor intact would let rare extremes keep dragging predictions off course.
Why the others are wrong
Fixed-width binning fails on skewed data because the outliers stretch the range and leave most bins nearly empty while extremes dominate presentation. Doing nothing is wrong because the skew is in a predictor the model will actually use, so accuracy still suffers. Dropping the whole field is excessive since only the outlier rows are bad, not the entire variable. None of these options removes the documented source of the distortion.
Certified-Tableau-CRM-and-Einstein-Discovery-Consultant exam tip
Treat any mention of outliers plus reduced accuracy as a pointer toward selective exclusion from the model. Distrust fixed-width binning answers when the data is described as skewed, since equal-width bins collapse under long tails.
- Improved ease of use for end users
- Discounted EA licenses when growth is achieved
- Better dashboard performance
- Automatic conditional formatting
The short version
AC — Progressive disclosure improves usability and performance. Showing essentials first reduces load and defers heavy queries.
Key concepts in this question
- Progressive disclosure: Reveal summary first, details on demand via pages, toggles, and drill-ins.
- Ease of use: Users face fewer widgets on initial load, speeding comprehension and adoption.
- Query deferral: Hidden content does not query until opened, cutting initial load time and compute.
Why AC is correct
Progressive disclosure designs the dashboard so the opening view answers the top question with minimal widgets, with deeper tables one click away. That simplification directly improves ease of use, and because off-screen pages and collapsed sections do not execute until requested, initial dashboard performance improves as well.
Why the others are wrong
- B. There is no EA license discount tied to the progressive-disclosure design principle.
- D. Conditional formatting is a separate widget formatting feature, not a benefit of disclosure layering.
Certified-Tableau-CRM-and-Einstein-Discovery-Consultant exam tip
Progressive disclosure = easier to use plus faster to load.
- Set the attribute “Include Record ID Column value” to true.
- Set the attribute “include_self_id” to false.
- Set the attribute “include_self_id” to true.
- Set the attribute “Include Record ID Column value” to false.
The short version
C — Set include_self_id to true in the flatten. That keeps the user's own role node so peers in the same role share data.
Key concepts in this question
- Role-hierarchy flattening: The flatten transformation materializes the Salesforce role tree into a bridge for security.
- include_self_id attribute: Controls whether the hierarchy table includes the record owner's own role ID alongside ancestors.
- Same-role visibility: Peers share a role ID, so inclusion of self makes peer-owned rows match the predicate.
Why C is correct
The recipe must reproduce hierarchy security but also let users in one role see each other's records. With include_self_id set to true, the flattened hierarchy retains the user's own role membership, so the security predicate matches both records owned above and below and records owned by others holding the same role ID.
Why the others are wrong
- A. Record ID column inclusion controls join keys, not same-role peer visibility.
- B. Setting include_self_id to false explicitly excludes the user's own role, hiding peer records.
- D. Setting the Record ID flag to false likewise does not toggle self-role inclusion.
Certified-Tableau-CRM-and-Einstein-Discovery-Consultant exam tip
Peers must see peers = include_self_id true in flatten.
- edgemart
- export
- sfdcDigest
- sfdcRegister
The short version
Data sync needs a transformation that names the Salesforce object and the fields being pulled, and that role belongs to the extraction step. The sfdcDigest transformation performs exactly that extraction from Salesforce objects into the dataflow. The register step only saves the finished stream as a dataset and reveals nothing about the source.
Key concepts in this question
A dataflow moves through extract, transform, and load stages, each handled by a distinct transformation type. The digest step opens the pipeline by querying named Salesforce objects and columns through the sync layer. Later steps such as augment, filter, and compute reshape the stream before registration. Data sync therefore consults the digest nodes to know which objects and fields are currently flowing.
Why C is correct
The sfdcDigest node declares the source object plus its field list, so it is the authoritative record of what sync is extracting. Salesforce documentation describes this transformation as the extractor of Salesforce object data for datasets. Every sync-backed dataflow begins with one digest per object, making it the natural reference point. Choosing it answers precisely which objects and fields are being pulled.
Why the others are wrong
The sfdcRegister step only persists the final transformed stream under a dataset alias and never declares source objects. Edgemart loads an already registered dataset rather than extracting live Salesforce records. Export pushes data outward instead of describing inbound extraction from Salesforce. None of these three tells sync which Salesforce fields are currently being read.
Certified-Tableau-CRM-and-Einstein-Discovery-Consultant exam tip
Map each dataflow verb to its stage whenever sync questions appear on the exam. Digest means extract from Salesforce, augment means join, register means save the dataset.
- computeField
- computeValue
- computeData
- computeExpression
The short version
D — computeExpression is the multi-type derived-field transformation. It is the only compute option that handles text plus a case-derived number plus a SAQL-derived date in one place.
Key concepts in this question
- computeExpression transformation: dataflow node that creates new fields or replaces values using a SAQL expression, supporting text, numeric, and date outputs.
- computeField legacy behavior: older single-field calculation with limited functions, superseded for mixed and complex logic.
- SAQL in dataflows: Salesforce Analytics Query Language expressions allow row-level logic such as case statements, date math, and string manipulation during data preparation.
- Dataflow vs recipe compute: in classic dataflows, computeExpression is the standard extensibility point for derived columns before registration.
Why D is correct
computeExpression is documented as the SAQL-based transformation for adding calculated columns in a dataflow. It accepts case expressions for the numeric requirement and SAQL date functions for the date requirement, so all three additions fit one transformation type. The referenced SAQL transformation help confirms this is the intended node for custom SAQL-derived fields. That flexibility is what the question tests.
Why the others are wrong
- A. computeField is the older limited compute with narrower expression support and is not the documented choice for combined SAQL plus case logic.
- B. computeValue is not a dataflow transformation for adding columns; it suggests a single scalar value rather than row-level derived fields.
- C. computeData is not a recognized dataflow compute transformation for this purpose and matches no documented node name.
Certified-Tableau-CRM-and-Einstein-Discovery-Consultant exam tip
Remember expression means SAQL expression: whenever a dataflow question mixes case plus SAQL date plus text, pick computeExpression.
- Assign the app permissions “viewer,” “editor,” and “manager” to the three types of roles defined.
- Create and assign three new Salesforce profiles according to the three types of roles defined.
- Assign “Tableau CRM Explorer” licenses to users that should only view the dashboard, and assign “Tableau CRM Developer” licenses to users that should be able to create datasets and dashboards.
- Create and assign Salesforce permission sets according to the three types of roles defined.
The short version
D — Use permission sets for the three access levels. Permission sets scale to 1000 viewers plus builders without profile sprawl.
Key concepts in this question
- Access model: Builders need create and edit rights; most users need view-only.
- Permission sets vs profiles: Permission sets grant additive Tableau CRM permissions to existing users at scale.
- App roles: Viewer, editor, and manager roles govern per-app sharing after platform access is granted.
Why D is correct
With 1000 users split into three builders, 15 creators, and the rest viewers, creating new profiles for each pattern is heavy and inflexible. Best practice is to leave profiles alone and assign purpose-built permission sets carrying the Tableau CRM permissions for each cohort, then use app-level viewer, editor, and manager sharing for content.
Why the others are wrong
- A. App viewer, editor, and manager alone does not grant the underlying platform access.
- B. Three new profiles for 1000 users creates maintenance overhead; permission sets are the scalable pattern.
- C. Explorer versus Developer licensing language misstates the assignment and ignores the permission-set mechanism.
Certified-Tableau-CRM-and-Einstein-Discovery-Consultant exam tip
1000 users, three tiers = permission sets, not new profiles.
Want the full bank of 96 questions for Certified Tableau CRM and Einstein Discovery Consultant? See all practice exams.