Securing Networks with Cisco Firepower (SNCF 300-710) — Free Practice Questions
10 free sample questions from a bank of 444, with the correct answers and explanations. No signup required — start practising right now.
- For the dynamic routing feature, if the master unit fails, the newly elected master unit maintains all existing connections.
- Integrated Routing and Bridging is supported on the master unit.
- Site-to-site VPN functionality is limited to the master unit, and all VPN connections are dropped if the master unit fails.
- All Firepower appliances support Cisco FTD clustering.
The short version
C — Centralized site-to-site VPN fails over with the control unit. Clustering boosts throughput and redundancy, but not every feature is distributed.
Key concepts in this question
- FTD clustering: groups multiple FTD units as one logical firewall for throughput and redundancy.
- Centralized vs. distributed features: some features run on all units, others only on the control (master) unit.
- Site-to-site VPN: a centralized feature in FTD clustering, anchored to the control unit.
Why C is correct
Site-to-site VPN in FTD clustering is centralized on the control unit. All tunnels terminate there, so if the control unit fails, VPN connections drop until the new control unit re-establishes them. Cisco documents this as a clustering limitation, alongside other centralized features such as dynamic routing protocol adjacency behavior. The answer captures the one real operational consequence listed.
Why the others are wrong
- A. Dynamic routing is centralized; adjacencies and many flows must reconverge after a control-role change rather than seamlessly preserving every connection.
- B. Integrated Routing and Bridging (IRB) is not supported with FTD clustering, so it cannot be cited as a result of enabling it.
- D. Only specific Firepower/FTD platforms and software versions support clustering; not every appliance does.
300-710 exam tip — memory hook
Remember: cluster = throughput, but VPN = control-unit anchored. If the exam mentions VPN plus clustering, think centralized and lost on failover.
- Redundant Interface
- EtherChannel
- Speed
- Media Type
- Duplex
The short version
C and E — A physical routed interface needs Speed and Duplex. FMC still asks for Layer-1 link parameters when the interface will carry routed traffic.
Key concepts in this question
- Routed interface: Layer-3 FTD interface with a name and IP address, forwarding by routing table.
- Speed and Duplex: physical auto-negotiation settings required to bring the link up correctly.
- Logical interface types: EtherChannel and Redundant interfaces are optional aggregations, not mandatory settings.
Why C and E are correct
When adding a physical routed interface in FMC, the required hardware section includes Speed and Duplex (commonly Auto/Auto, or explicit values for fiber/copper). Without compatible Layer-1 settings the link stays down and routing never matters, so Cisco treats them as required fields on physical ports. They apply per physical member regardless of the Layer-3 configuration above them.
Why the others are wrong
- A. A Redundant Interface is an optional active/standby pair for resiliency, not a mandatory setting for every routed port.
- B. EtherChannel is an optional link-aggregation type; a single routed physical interface does not need it.
- D. Media Type matters only on multi-media ports and defaults automatically; it is not one of the two universally required routed-interface settings.
300-710 exam tip — memory hook
Routed = Layer 3 plus Layer 1. If the choices mix logical types with Speed/Duplex, pick the copper reality: speed and duplex.
- reports
- context explorer
- dashboards
- event viewer
The short version
A — Scheduled reports automate monthly application-usage delivery. Management wants recurring output without manual clicks.
Key concepts in this question
- FMC reports: scheduled, repeatable documents that can be emailed automatically.
- Dashboards: real-time widgets for operators, not scheduled management mailings.
- Context Explorer and Event Viewer: interactive investigation tools for analysts.
Why A is correct
FMC Reports are designed for exactly this workflow: define the application-usage report once, set a monthly schedule, and have it generated and emailed to management automatically. That satisfies hands-off recurring visibility, with history preserved for trending. Reports pull from the same connection and discovery data seen interactively, but package it on a calendar.
Why the others are wrong
- B. Context Explorer gives interactive graphs of applications, users, and hosts but must be opened manually; it does not email itself monthly.
- C. Dashboards show at-a-glance health and activity for daily operations, not scheduled emailed summaries.
- D. Event Viewer is for drilling into individual connection, intrusion, and malware events, not for automated monthly rollups.
300-710 exam tip — memory hook
Automatic plus periodic plus management equals Reports. Interactive equals Explorer, Viewer, or Dashboard.
- A ג€troubleshootג€ file for the device in question.
- A ג€show techג€ file for the device in question.
- A ג€troubleshootג€ file for the Cisco FMC.
- A ג€show techג€ for the Cisco FMC.
The short version
C — A failed Snort policy deployment is an FMC-side problem, so collect the FMC troubleshoot bundle. TAC needs the orchestrator logs, not the managed device.
Key concepts in this question
- FMC policy deployment: FMC compiles and pushes Snort/inspection policy to managed FTDs.
- Troubleshoot bundle: log package generated from the FMC GUI for TAC analysis.
- Show tech: CLI output focused on a single device data plane and system state.
Why C is correct
When deployment messages fail in FMC, the failure typically occurs during validation, packaging, or communication initiated by FMC. The FMC troubleshoot file captures deployment managers, policy compilation, Snort rule handling, and job history that TAC needs. A device bundle alone misses the manager-side error, so Cisco TAC asks for the FMC bundle first for deployment failures.
Why the others are wrong
- A. A device troubleshoot bundle helps for data-plane crashes, but deployment orchestration logs live on FMC.
- B. Show tech on the device shows version and process state, not why FMC failed to build or push the Snort policy.
- D. Show tech for FMC via CLI is less complete for this workflow than the GUI troubleshoot bundle TAC requests.
300-710 exam tip — memory hook
Deployment fails in FMC, troubleshoot FMC. Data plane crashes on FTD, troubleshoot FTD.
The short version
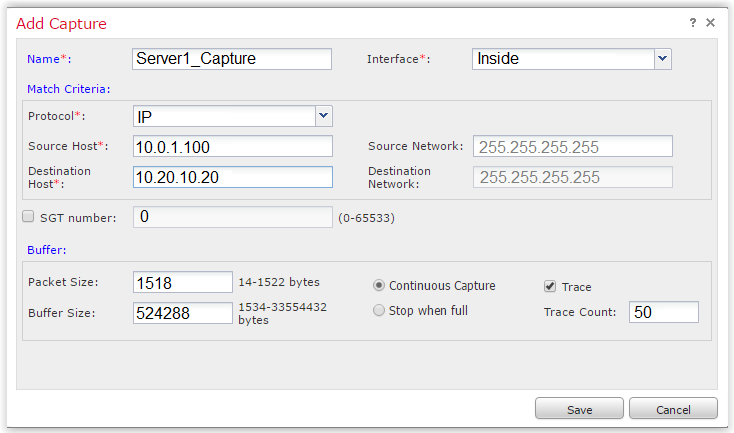
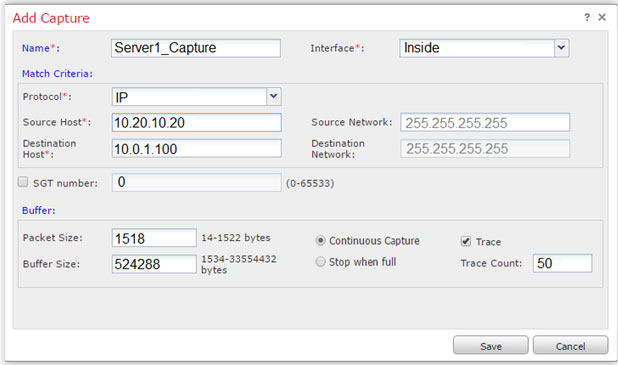
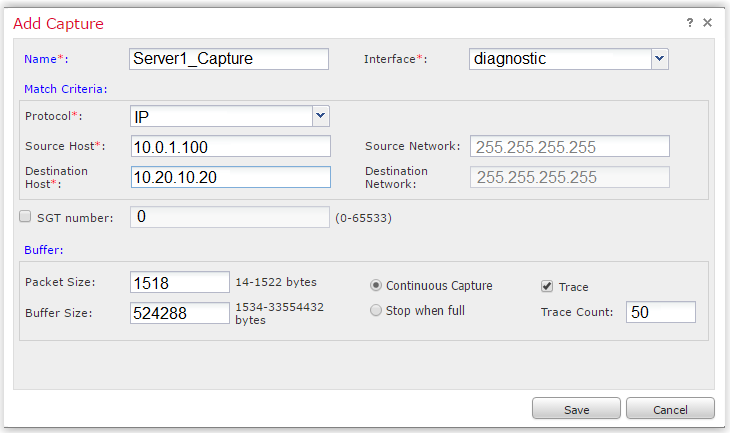
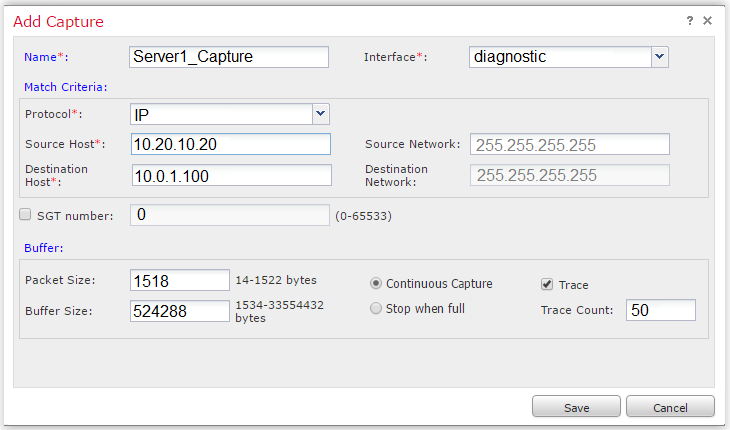
MATCH — Inside plus 10.20.10.20 plus 10.0.1.100 plus TCP 9443 captures the failing flow.
Match interface and 5-tuple to the inside-to-server path.
Key concepts in this question
FTD captures filter by ingress interface plus IP 5-tuple.
- Interface selection: inside is where the connection is initiated.
- Host filters: source is the engineer host, destination is the web server.
- Port filter: non-standard 9443 over TCP narrows to the failing service.
Why this mapping is correct
Each parameter lands on the value from the stem.
Ingress interface is inside because the connection starts there, source host is 10.20.10.20, destination host is 10.0.1.100, and destination port is TCP 9443 per the non-standard web port. This 4-way match isolates exactly the inside-to-server flow for troubleshooting.
Why the others are wrong
- Outside as ingress: the flow originates inside, capturing outside misses the pre-NAT and ingress decision.
- Swapped hosts: reversing source and destination matches return traffic only, not the initiated request.
- Port 443 or any-port: standard HTTPS or unfiltered captures dilute the failing 9443 flow.
- Wrong protocol: UDP or ICMP filters exclude the TCP web connection entirely.
300-710 exam tip
Mirror the stem into the capture: inside plus source plus dest plus TCP 9443.
- Use the Packet Export feature to save data onto external drives.
- Use the Packet Capture feature to collect real-time network traffic.
- Use the Packet Tracer feature for traffic policy analysis.
- Use the Packet Analysis feature for capturing network data.
The short version
B — Use Packet Capture to see real traffic during utilization-driven disconnects. Random drops at 90% load need evidence, not simulation.
Key concepts in this question
- Packet Capture: records actual packets traversing FTD interfaces for later analysis.
- Packet Tracer: simulates a hypothetical packet through the policy without live traffic.
- Buffer exhaustion: sustained high CPU/throughput can tail-drop connections.
Why B is correct
When monitoring shows the FTD above 90% and users report random disconnects, the next step is collecting live traffic with Packet Capture to correlate drops, retransmits, and interface discards with load spikes. Capture proves what is really being forwarded versus dropped under stress. It provides PCAP evidence TAC or the engineer can filter by application, host, or time window.
Why the others are wrong
- A. Packet Export to external drives is about offloading stored files, not the standard first step for analyzing live disconnects.
- C. Packet Tracer only models policy decisions for a crafted packet; it cannot show overload drops or intermittent behavior.
- D. There is no standard FTD feature called Packet Analysis for capturing network data; it is a distractor name.
300-710 exam tip — memory hook
Real and random equals Capture. Hypothetical and policy equals Tracer.
- by performing a packet capture on the firewall
- by attempting to access it from a different workstation
- by running Wireshark on the administrator's PC
- by running a packet tracer on the firewall
The short version
A — A firewall packet capture proves whether SSH ever arrives. Reachability questions need data-plane proof.
Key concepts in this question
- Ingress capture: shows packets arriving on the firewall interface before policy drops.
- Egress capture: confirms whether permitted traffic leaves toward the switch.
- Simulation vs. observation: tracer predicts, capture observes.
Why A is correct
Running a packet capture filtered for the administrator workstation and TCP port 22 shows definitively whether SSH SYN packets reach the firewall and whether they exit toward the data-center switch. That isolates the fault domain: no ingress means an upstream routing or VPN issue, while ingress without egress points to firewall policy or NAT. It is the fastest empirical check before changing rules.
Why the others are wrong
- B. Trying another workstation only adds anecdotes; it does not prove where packets stop.
- C. Wireshark on the PC shows what left the PC, not what arrived at or passed through the firewall.
- D. Packet Tracer simulates policy for a theoretical packet and can miss routing, path, or live link problems.
300-710 exam tip — memory hook
Is it reaching us? Capture. Would policy allow it? Tracer.
- Risk Report
- SNMP Report
- Standard Report
- Malware Report
The short version
C — A Standard Report gives the high-level FTD summary management wants. Peak season needs uptime posture, not deep malware forensics.
Key concepts in this question
- Standard Report: prebuilt summary of health, traffic, applications, and policy hits.
- Risk Report: user- and host-risk scoring for security response.
- Malware Report: focused on file and malware dispositions.
Why C is correct
A Standard Report aggregates appliance health, interface status, top applications, intrusion and connection summaries into a management-ready overview. That matches the request for high-level statistics to protect uptime during peak season. It can be generated on demand or scheduled without building custom searches, giving leadership trend and capacity context quickly.
Why the others are wrong
- A. A Risk Report highlights risky users and hosts for investigation, not overall appliance summary statistics.
- B. There is no standard FMC report type called SNMP Report; SNMP is a monitoring protocol, not a report template.
- D. A Malware Report narrows to malware events and file trajectories, too specific for a general uptime summary.
300-710 exam tip — memory hook
Management summary equals Standard. Hunt the risky user equals Risk. Hunt the file equals Malware.
- Create a service identifier to enable the NetFlow service.
- Add the NetFlow_Send_Destination object to the configuration.
- Create a Security Intelligence object to send the data to Cisco Stealthwatch.
- Add the NetFlow_Add_Destination object to the configuration.
The short version
D — NetFlow parameters alone export nothing; add the NetFlow_Add_Destination object. The collector address completes the export path.
Key concepts in this question
- NetFlow_Set_Parameters: defines what flow data FTD exports and timers used.
- NetFlow destination object: defines where flows are sent, namely the Stealthwatch collector.
- FlexConfig/policy wiring: both objects must be referenced before export starts.
Why D is correct
Creating NetFlow_Set_Parameters only describes the export template. FTD still needs the destination collector IP, port, and VRF supplied by the NetFlow_Add_Destination object and applied in the FlexConfig or platform policy. Without it, the device knows what to send but has nowhere to send it, so Stealthwatch receives nothing. Adding the destination object and redeploying starts the flow stream.
Why the others are wrong
- A. No service-identifier object enables NetFlow; the feature is enabled by parameters plus destination, not a service flag.
- B. NetFlow_Send_Destination is not the recognized object name in this workflow; the banked object is NetFlow_Add_Destination.
- C. Security Intelligence controls block/allow lists, not NetFlow export to a flow collector.
300-710 exam tip — memory hook
Parameters equal what, Destination equal where. No where, no flow.
- Manually adjust the time to the correct hour on all managed devices.
- Configure the system clock settings to use NTP with Daylight Savings checked.
- Configure the system clock settings to use NTP.
- Manually adjust the time to the correct hour on the Cisco FMC.
The short version
C — Fix a one-hour syslog skew with NTP time sync. Manual clock edits drift again.
Key concepts in this question
- NTP synchronization: keeps FMC and managed devices on a common authoritative clock.
- System clock settings: central FMC time configuration pushed or referenced by devices.
- Log correlation: consistent timestamps are required for incident timelines.
Why C is correct
An exact one-hour offset after a summer-time change points to clock drift or inconsistent timezone handling that NTP corrects by syncing to a reliable source. Configuring NTP in system clock settings aligns FMC and managed devices automatically and prevents recurrence. Cisco best practice is NTP everywhere rather than hand-setting clocks, which diverge and break cross-device correlation.
Why the others are wrong
- A. Manually adjusting every managed device is error-prone, unscalable, and drifts again without a time source.
- B. The banked UI action is plain NTP; a separate Daylight Savings checkbox is not the documented fix and adds an invented step.
- D. Fixing only FMC leaves managed-device timestamps inconsistent and does not solve fleet-wide skew.
300-710 exam tip — memory hook
Logs off by an hour, think source of time. NTP everywhere, hands off clocks.
Want the full bank of 444 questions for Securing Networks with Cisco Firepower (SNCF 300-710)? See all practice exams.